

Build a Data Analytics Agent Using Custom Connectors
Imagine your dashboard says paid conversions fell 18%. Before changing a campaign or rewriting checkout, you need to answer: did customers stop buying, or did tracking break?
In this tutorial, you will build a reusable analyst that investigates that question for you. The agent looks up the company’s metric definition, queries the data, checks what changed, and returns evidence. Next you ask about enterprise customers and get a chart from the same conversation. Once the Agent API customizations (managed connectors, versioned skills, instructions, and tools) are configured, your application sends a profile ID and a question. The profile supplies the saved configuration instead of making each application rebuild it.
This is the Agent API call your client will make after setup. Your application does not supply the investigation's SQL, a charting workflow, or the data-server credential.
Preview the Agent API request
from perplexity import Perplexity
import os

client = Perplexity()
response = client.responses.create(
    profile={"type": "custom", "id": os.environ["BRIGHTSIDE_PROFILE_ID"]},
    input="Why did paid conversions drop in the week of September 7 through September 13, 2026?",
)
print(response.output_text)
What Agent API does for your application
Section titled “What Agent API does for your application”You will configure the analyst once, ask it to investigate, then continue the conversation to get an enterprise chart. Each part of the experience uses an Agent API customization:
| Agent API feature | Its role in your analyst |
|---|---|
| Connector | Give the agent access to company context and read-only data tools |
| Versioned skill | Supply a reusable investigation method and metric guidance |
| Instructions | Define the analyst's job and how it should present evidence |
| Sandbox tool | Accept a prompt from the agent, determine what code to run, and return results |
| Profile | Save these choices and the model under one ID your application can invoke |
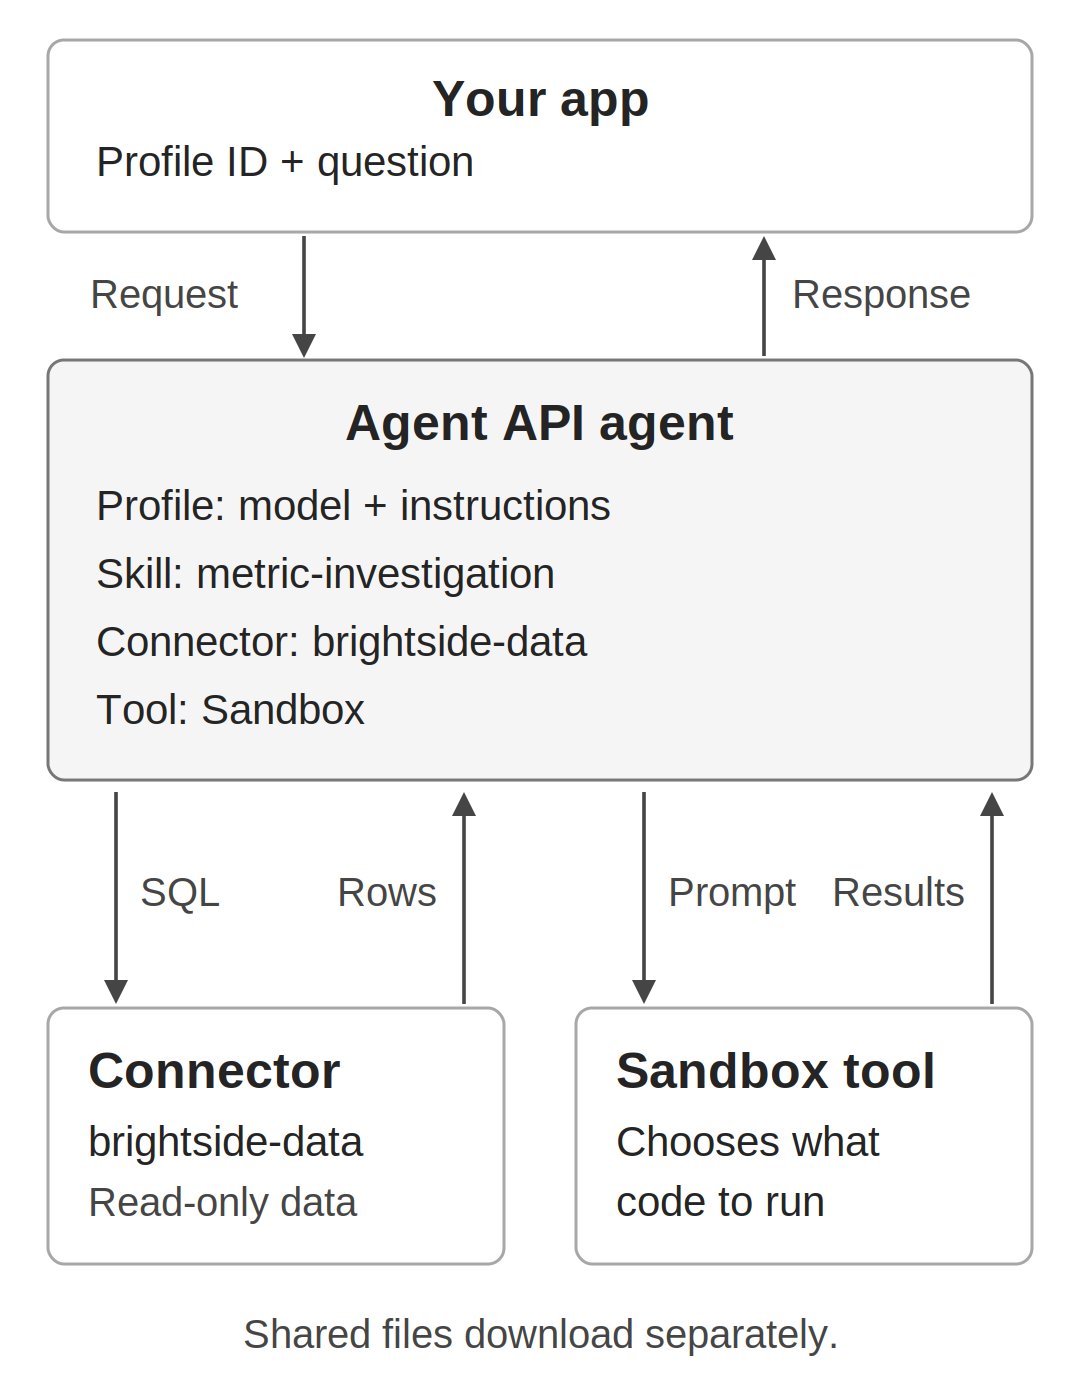
The agent chooses when to use its tools. It sends Sandbox a prompt, not a direct code-execution request. Sandbox determines what runs; you review the returned evidence and chart.
Prepare your project
Section titled “Prepare your project”You need Python 3.12 or newer, an API Project with credits, and a Project API key. A Project administrator configures the connector, skill, and profile. Once you save that configuration, org members can use the analyst profile in their applications.
The terminal commands use Bash. On macOS, run bash in each terminal before following them; on Windows, use a Bash terminal in WSL.
Choose your data path before starting. The local server is sample infrastructure, not an Agent API requirement.
| Data path | What you need |
|---|---|
| Existing hosted connector | A registered connector in your API Project. No local MCP server or cloudflared. |
| Local Brightside sample | Add the optional data_server.py below. The local server setup uses MCP and cloudflared. |
The example uses Brightside Coffee, a fictional subscription business. Its metric counts non-test accounts that signed up and started a paid subscription in the same Monday-to-Sunday week. To reproduce the questions and counts, your connector must serve this sample's data and context through describe_tables, search_context, and run_sql. For another data source, adapt the tools, skill, instructions, schema, and SQL dialect; the Brightside results will not apply.
Plan the files before creating them
Section titled “Plan the files before creating them”Your application has one file: ask.py. The skill is one folder containing its instructions, SQL reference, and chart helper, packaged together as a ZIP. Add data_server.py only for the local sample; it includes its own data and company context.
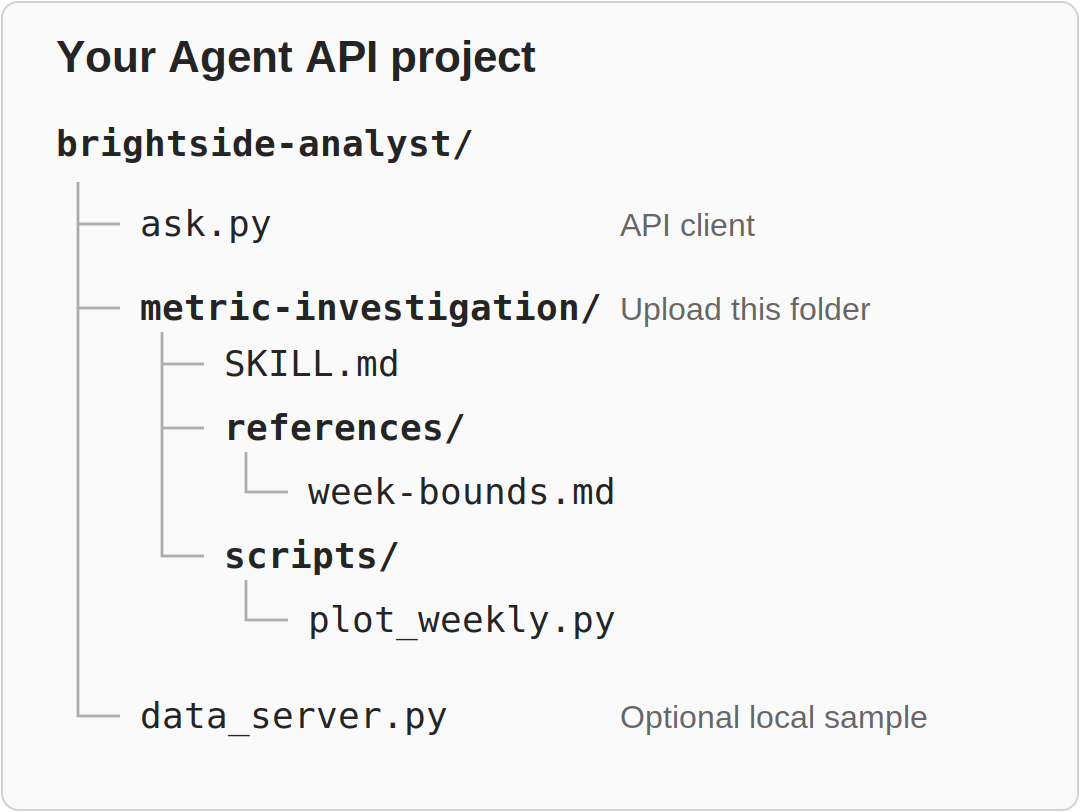
Create the working folder and install the client library. If you use the downloadable skill ZIP, you can skip creating the skill folder's contents yourself.
Create the folders and install the Perplexity Python library
mkdir -p brightside-analyst/metric-investigation/{references,scripts}
cd brightside-analyst
python3 -m venv .venv
source .venv/bin/activate
pip install perplexityai==0.43.5
Write your Agent API client
Section titled “Write your Agent API client”Create ask.py in the working folder and copy the complete file below. It calls Agent API and records what happened; it does not implement the analyst's investigation.
ask.py
import argparse
import json
import os
from pathlib import Path

from perplexity import Perplexity

LAST_RESPONSE = Path("last_response.json")
RUNS = Path("runs")


def ask(client, profile_id, question, version="latest", model=None, previous_id=None):
    """Call Agent API; the saved profile supplies the analyst's configuration."""
    request = {
        # Reuse the configured model, instructions, skills, connector, and tools.
        "profile": {"type": "custom", "id": profile_id, "version": version},
        "input": question,
    }
    if model:
        # Compare a provider without rebuilding the profile.
        request["model"] = model
        request["max_output_tokens"] = 16384
    if previous_id:
        # Continue the investigation through Agent API conversation state.
        request["previous_response_id"] = previous_id
    return client.responses.create(**request)


def show_work(response):
    folder = RUNS / response.id
    folder.mkdir(parents=True, exist_ok=True)
    receipt = folder / "response.json"
    receipt.write_text(response.model_dump_json(indent=2))
    print(f"evidence: {receipt}")
    print(f"status: {response.status}")
    if response.error:
        print(f"response error: {response.error}")
    calls = 0
    for item in response.output:
        if item.type == "skill_loaded":
            print(f"[skill] load attempt: {item.name}")
        elif item.type == "mcp_list_tools":
            print(f"[{item.server_label}] {len(item.tools or [])} tools available")
            if item.error:
                print(f"connector error: {item.error}")
        elif item.type == "mcp_call":
            calls += 1
            arguments = json.loads(item.arguments or "{}")
            detail = arguments.get("sql") or arguments.get("query") or json.dumps(arguments)
            suffix = f" -> error: {item.error}" if item.error else ""
            print(f"[{item.server_label}] {item.name}: {detail}{suffix}")
            try:
                result = json.loads(item.output or "{}")
                if isinstance(result, dict) and result.get("error"):
                    print(f"SQL/tool error: {result['error']}")
            except (TypeError, json.JSONDecodeError):
                pass
        elif item.type == "tool_search_output":
            print(f"[tool search] {item.arguments}")
        elif item.type == "sandbox_results":
            print(f"[sandbox] ran {item.language} code, status {item.status}")
        elif item.type == "share_file":
            print(f"[file] {item.filename}")
    print()
    print(response.output_text)
    print()
    print(f"mcp_call items: {calls}")
    cost = getattr(getattr(response.usage, "cost", None), "total_cost", None)
    print(f"cost: ${cost:.4f}" if cost is not None else "cost: not reported")
    print(f"response id: {response.id}")
    if response.status == "completed":
        LAST_RESPONSE.write_text(json.dumps({"id": response.id}))
        return True
    return False


def download_files(client, response):
    if not any(item.type == "share_file" for item in response.output):
        return
    folder = RUNS / response.id / "files"
    folder.mkdir(parents=True, exist_ok=True)
    for file in client.responses.files.list(response.id).data:
        name = file.filename
        if not name or name in {".", ".."} or "/" in name or "\\" in name:
            raise ValueError(f"Unsafe filename: {name!r}")
        target = folder / name
        if target.exists():
            raise FileExistsError(f"Refusing to overwrite {target}")
        content = client.responses.files.content(file_id=file.id, response_id=response.id)
        content.write_to_file(target)
        print(f"downloaded {target} ({file.bytes} bytes)")


def main():
    parser = argparse.ArgumentParser(description="Ask the Brightside analyst a question.")
    parser.add_argument("--ask", help="start a new conversation with this question")
    parser.add_argument("--follow-up", help="continue the last conversation with this question")
    parser.add_argument("--model", help="run the profile with a different model for this request")
    parser.add_argument("--version", default="latest", help="profile version to run (default: latest)")
    parser.add_argument("--profile", default=os.environ.get("BRIGHTSIDE_PROFILE_ID"))
    args = parser.parse_args()
    if not args.profile:
        parser.error("pass --profile or set BRIGHTSIDE_PROFILE_ID")
    if bool(args.ask) == bool(args.follow_up):
        parser.error("pass exactly one of --ask or --follow-up")
    previous_id = None
    if args.follow_up:
        try:
            previous_id = json.loads(LAST_RESPONSE.read_text())["id"]
        except (OSError, ValueError, KeyError):
            parser.error("no valid conversation checkpoint; run --ask first")
    question = args.ask or args.follow_up
    client = Perplexity()
    response = ask(client, args.profile, question, args.version, args.model, previous_id)
    if not show_work(response):
        raise SystemExit("Run did not complete. Read the saved response; checkpoint unchanged.")
    download_files(client, response)


if __name__ == "__main__":
main()- Imports and paths: Load the command-line, JSON, environment, file, and API helpers.
RUNSstores responses;LAST_RESPONSEstores the conversation checkpoint. ask(): Callclient.responses.create()with a profile and question. Optional arguments select a profile version, override the model, or continue a conversation.show_work(): Save the complete response and print its answer, tool activity, errors, and reported cost. Only completed responses advance the checkpoint.download_files(): Retrieve shared files through the response files endpoints. Use per-response folders, reject path-like names, and refuse overwrites.main()and the entry point: Parse your flags, create the API client, send the request, and handle the response. Reject a follow-up without a valid checkpoint.
If you already have a working Brightside profile, skip configuration and go to Ask your first question. Agent requests use your API credits; the client uses the library's default retry behavior.
Configure your Agent API analyst
Section titled “Configure your Agent API analyst”Give the agent a reusable investigation method
Section titled “Give the agent a reusable investigation method”Use the metric-investigation skill to tell the agent how to investigate, rather than repeating the method in every question. Its description explains when to load it; its instructions ask the agent to check definitions, compare consistent weeks, investigate tracking changes, and show evidence.
Keep the skill as a folder so its instructions, reference, and chart helper travel together. You can download the complete skill ZIP, or create these three files at the paths shown.
metric-investigation/SKILL.md
---
name: metric-investigation
description: Load when asked why a business metric changed, dropped, or spiked, or for a follow-up that narrows or charts an earlier investigation. Do not load for simple lookups or single-number questions.
compatibility: Requires a data connector that exposes describe_tables, search_context, and run_sql. Charts need the Sandbox tool.
---

# Metric investigation

You are investigating a change in a business metric. Work in this order.

1. Call `describe_tables` first. Learn which system writes each table. If a tool you need is missing from one tool search, search again by its exact name before you say it is unavailable.
2. Call `search_context` for the metric name before you write your own definition. This demo matches every search word; if nothing matches, retry with fewer words, such as `paid conversion` or `mobile`. Use the team's definition when one exists and say which one you used.
3. Run SQL for every number you report, including differences and percentages. Never estimate or guess a count. Exclude test accounts from every signup, conversion, and billing diagnostic unless explicitly comparing all, non-test, and test accounts. Filter the rows being counted: `LEFT JOIN accounts ... AND a.is_test = 0` does not filter `COUNT(s.account_id)`. Use an inner join, a prefiltered CTE, or a conditional count. Read the daily example in `references/week-bounds.md` when retaining zero-count days.
4. Compare the period in question with at least three earlier Monday to Sunday weeks, using the same query with explicit date bounds. Read `references/week-bounds.md` before writing the first weekly query. Both signup and subscription start must fall inside that same week's bounds. Keep these bounds in every device, segment, and plan breakdown; only the grouping or cohort filter changes. Neither same-day matching nor a rolling seven days after signup implements this metric. Check that mutually exclusive breakdown counts sum to the weekly totals.
5. Before you conclude that the business changed, check whether the measurement changed. Break the metric down by device, segment, and plan. Look for a dimension that goes to zero or near zero on specific days, and check whether the tables that feed the metric moved together or separately.
6. Missing signup rows damage both the numerator and denominator of this metric. Label the measured rate as observed; it does not establish whether the true rate improved, stayed stable, or deteriorated. Billing accounts without an observed signup do not reveal their missing signup dates. Do not reconstruct exact true cohort counts or rates from them. Keep observed counts, billing totals, and estimates separate, and state what remains unknown.
7. Check every tool result before using it. A failed or truncated diagnostic is not evidence. If a required check fails, name the check and error, give only the supported findings, and say the investigation is incomplete. Do not treat a completed API response as proof that its analysis is correct.

When the user asks for a chart, send Sandbox a prompt containing the complete successful, untruncated SQL result, preserving `columns`, `rows`, and `truncated`. Columns must include `week_start`, `signups`, and `paid_conversions`. Ask Sandbox to save it as `result.json` and use the bundled `scripts/plot_weekly.py` helper from this skill's directory with a title matching the requested cohort. The helper accepts `result.json`, `chart.png`, and the title as its three arguments. Ask Sandbox to share both the PNG and input JSON. If the helper is unavailable, ask Sandbox to generate an equivalent grouped bar chart with a zero baseline, direct labels, explicit week dates, and the cohort title. Note that the data is synthetic and September 9 to 12 mobile signup records are missing. Sandbox determines what code runs; do not claim the helper executed without evidence. Compare the returned chart and input data with the SQL result before presenting them.

Answer in this shape:

- **Finding.** One or two sentences on what moved and whether the evidence points to the business or the measurement.
- **Evidence.** The numbers, with the periods they cover.
- **SQL.** Every query you ran, in the order you ran it.
- **Assumptions.** Definitions you chose, filters you applied, and anything you could not check.

Do not change source data or publish messages. Creating the requested local chart and its input file is allowed.
SKILL.md contains the investigation sequence and answer format. For charts, it asks the agent to prompt Sandbox with the query results and request the bundled helper.
metric-investigation/references/week-bounds.md
# Week bounds in SQLite

Weeks run Monday to Sunday. Write both bounds out. Do not derive the week from the day inside the query.

Good:

```sql
WHERE s.day BETWEEN '2026-09-07' AND '2026-09-13'
```

Bad, because `date(day, 'weekday 1', '-7 days')` moves every Monday into the week before it:

```sql
GROUP BY date(s.day, 'weekday 1', '-7 days')
```

Also avoid `strftime('%W', day)`: it numbers weeks from the first Monday of the year and does not match the team's calendar at year boundaries.

Template for same-week paid conversions, one row per week:

```sql
WITH weeks(week_start) AS (
  VALUES ('2026-08-17'), ('2026-08-24'), ('2026-08-31'), ('2026-09-07')
)
SELECT
  w.week_start,
  COUNT(s.account_id) AS signups,
  SUM(EXISTS (
    SELECT 1 FROM subscriptions b
    WHERE b.account_id = s.account_id
      AND b.started_day BETWEEN w.week_start AND date(w.week_start, '+6 days')
  )) AS paid_conversions
FROM weeks w
JOIN signups s ON s.day BETWEEN w.week_start AND date(w.week_start, '+6 days')
JOIN accounts a ON a.id = s.account_id AND a.is_test = 0
GROUP BY w.week_start
ORDER BY w.week_start;
```

Add `AND a.segment = 'enterprise'` to the accounts join for the enterprise version.

## Keep the metric unchanged in breakdowns

For device, segment, or plan breakdowns, add that dimension to `SELECT` and `GROUP BY` in the weekly template. Keep both date predicates anchored to `w.week_start`. Sum the breakdown counts back to the headline counts for each week.

Do not replace the subscription predicate with `b.started_day = s.day` or `b.started_day BETWEEN s.day AND date(s.day, '+6 days')`. Those count same-day and rolling-seven-day conversions, respectively, not same-calendar-week conversions.

## Filter the counted cohort before a left join

This template keeps days with zero observed signups while excluding test accounts before counting:

```sql
WITH days(day) AS (
  VALUES ('2026-09-09'), ('2026-09-10'), ('2026-09-11'), ('2026-09-12')
),
devices(device) AS (VALUES ('web'), ('mobile')),
eligible_signups AS (
  SELECT s.account_id, s.day, s.device
  FROM signups s
  JOIN accounts a ON a.id = s.account_id
  WHERE a.is_test = 0
)
SELECT d.day, v.device, COUNT(s.account_id) AS signups
FROM days d
CROSS JOIN devices v
LEFT JOIN eligible_signups s ON s.day = d.day AND s.device = v.device
GROUP BY d.day, v.device
ORDER BY d.day, v.device;
```

By contrast, `LEFT JOIN accounts a ON a.id = s.account_id AND a.is_test = 0` followed by `COUNT(s.account_id)` still counts test signups. It only makes the joined account fields null. Apply the cohort filter to billing diagnostics too.

## Separate billing activity from observed conversions

The following diagnostic counts non-test billing starts and those without a matching observed signup in the same week:

```sql
SELECT
  COUNT(*) AS billing_starts,
  SUM(NOT EXISTS (
    SELECT 1 FROM signups s
    WHERE s.account_id = b.account_id
      AND s.day BETWEEN '2026-09-07' AND '2026-09-13'
  )) AS without_observed_same_week_signup
FROM subscriptions b
JOIN accounts a ON a.id = b.account_id AND a.is_test = 0
WHERE b.started_day BETWEEN '2026-09-07' AND '2026-09-13';
```

An unmatched billing row may belong to an earlier signup or a missing signup. Without its signup date, you cannot assign it to the true weekly signup cohort. Report the observed rate separately and leave the true cohort size, conversions, and rate unknown.
The supporting reference provides same-calendar-week SQL, a filtered daily query that preserves zero-count days, and a separate billing diagnostic. The skill tells the agent to keep the same metric and cohort in every breakdown.
metric-investigation/scripts/plot_weekly.py
import json
import subprocess
import sys


def load_rows(path):
    with open(path) as source:
        result = json.load(source)
    if result.get("truncated") or result.get("error"):
        raise ValueError("Use a successful, untruncated SQL result.")
    rows = [dict(zip(result["columns"], row, strict=True)) for row in result["rows"]]
    required = {"week_start", "signups", "paid_conversions"}
    if not rows or not required <= set(result["columns"]):
        raise ValueError("Expected weekly signups and paid_conversions.")
    return rows


def plot(rows, target, title):
    subprocess.run([sys.executable, "-m", "pip", "install", "--quiet", "matplotlib"], check=True)
    import matplotlib

    matplotlib.use("Agg")
    import matplotlib.pyplot as plt

    weeks = [row["week_start"] for row in rows]
    signups = [row["signups"] for row in rows]
    paid = [row["paid_conversions"] for row in rows]
    positions = range(len(weeks))
    figure, axis = plt.subplots(figsize=(8, 4.5))
    axis.bar([p - 0.2 for p in positions], signups, width=0.4, label="Signups", color="#1f77b4")
    axis.bar([p + 0.2 for p in positions], paid, width=0.4, label="Paid conversions", color="#ff7f0e")
    for p, value in zip(positions, signups):
        axis.text(p - 0.2, value, str(value), ha="center", va="bottom", fontsize=9)
    for p, value in zip(positions, paid):
        axis.text(p + 0.2, value, str(value), ha="center", va="bottom", fontsize=9)
    axis.set_xticks(list(positions))
    axis.set_xticklabels([f"Week of {week}" for week in weeks])
    axis.set_ylabel("Accounts")
    axis.set_title(title)
    axis.legend()
    figure.text(0.5, 0.02, "Synthetic data; Sep 9 to 12 mobile signup records are missing.",
                ha="center", fontsize=8)
    figure.tight_layout(rect=(0, 0.06, 1, 1))
    figure.savefig(target, dpi=150)
    plt.close(figure)
    print(f"wrote {target}")


if __name__ == "__main__":
    plot(load_rows(sys.argv[1]), sys.argv[2], sys.argv[3])
The chart helper accepts the connector's JSON results and produces a labeled PNG. It rejects errors and truncated data. The agent requests this helper through a Sandbox prompt, not a direct code-execution call; Sandbox determines what runs. If the helper is unavailable, the skill asks for an equivalent chart from the same query results. The helper belongs to the skill, not your application's workflow.
Package the entire metric-investigation/ folder, not SKILL.md alone:
Package the skill
zip -r metric-investigation.zip metric-investigationOpen your API Project's Skills page. Select Create skill, or Update for an existing skill. Drop metric-investigation.zip into the upload area, or click to browse, then select Continue.
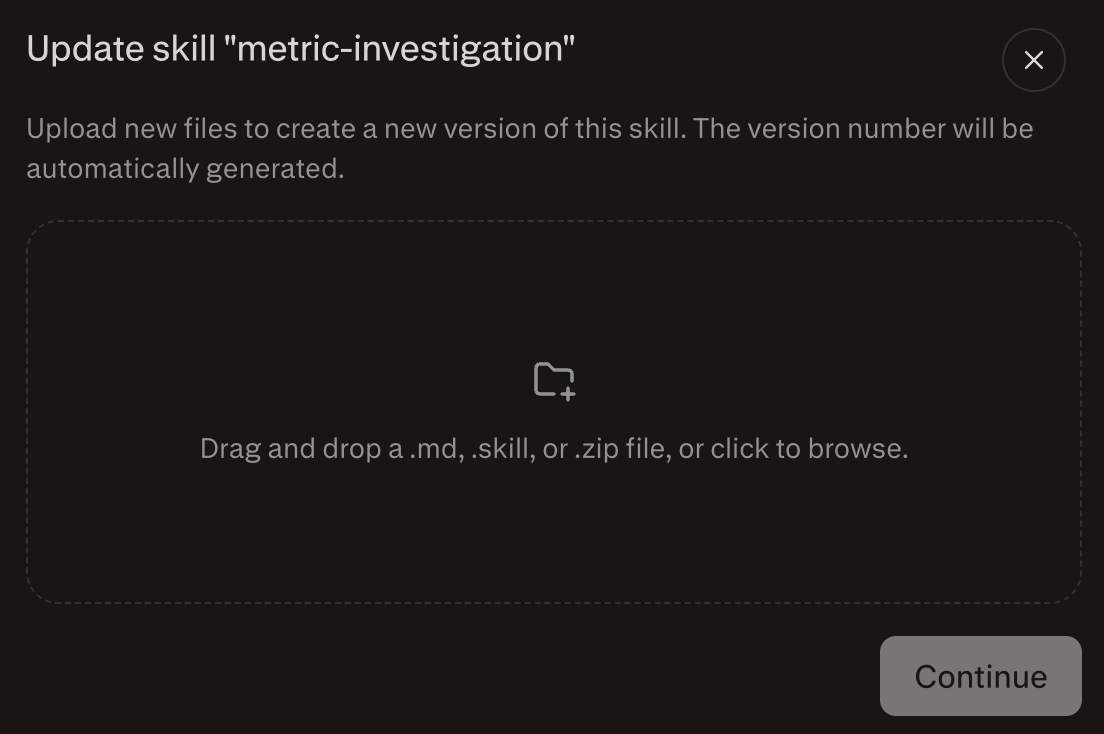
The screenshot shows updating an existing skill, which creates a new version. Confirm that your upload succeeds, then select that version when you configure the profile.
Connect the agent to your data
Section titled “Connect the agent to your data”Your connector lets Agent API access the data tools without giving your application the server's credential. If you already have a compatible hosted connector in this Project, select it in the profile below and skip server setup.
If you need the synthetic Brightside server, follow Run the sample server locally, then return here with its HTTPS URL and token. Register it on the Project connectors page:
- Name:
brightside-data - MCP server URL: Your server's HTTPS URL plus
/mcp - Authentication: API Key, using your
DATA_SERVER_KEY - Transport: Streamable HTTP
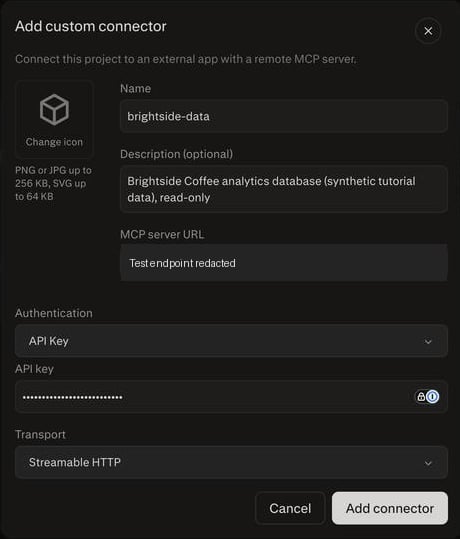
Use your endpoint, not the screenshot's test host. Confirm that the connector exposes describe_tables, search_context, and run_sql; see the connector reference for Project-scoped credentials.
Save the customizations in a profile
Section titled “Save the customizations in a profile”On the Profiles page, create a Custom profile. This is the configuration your application will invoke by ID.
| Setting | Value |
|---|---|
| Name | brightside-analyst |
| Model | openai/gpt-5.6-luna |
| Max steps | 12 |
| Tool | Sandbox |
| Skill | metric-investigation, pinned to the successfully uploaded revision |
| Connector | brightside-data, or your compatible hosted connector |
Paste the instructions below. They define the analyst's role and output; the skill supplies its investigation method.
Copy the profile instructions
You are the data analyst for Brightside Coffee, a subscription box company.
You answer questions about business metrics using the brightside-data connector.
The data is read-only. Run SQL for every number you report and show each query you ran.
Prefer the team's metric definitions from search_context over your own.
Use Monday to Sunday weeks with explicit date bounds, and anchor to the dates in the question or the latest complete week in the data.
When a metric moves, check whether the measurement changed before concluding the business changed.
Answer with the finding first, then the evidence, then the SQL, then your assumptions.
When the user asks for a chart, build it in the sandbox from the query results and share the file.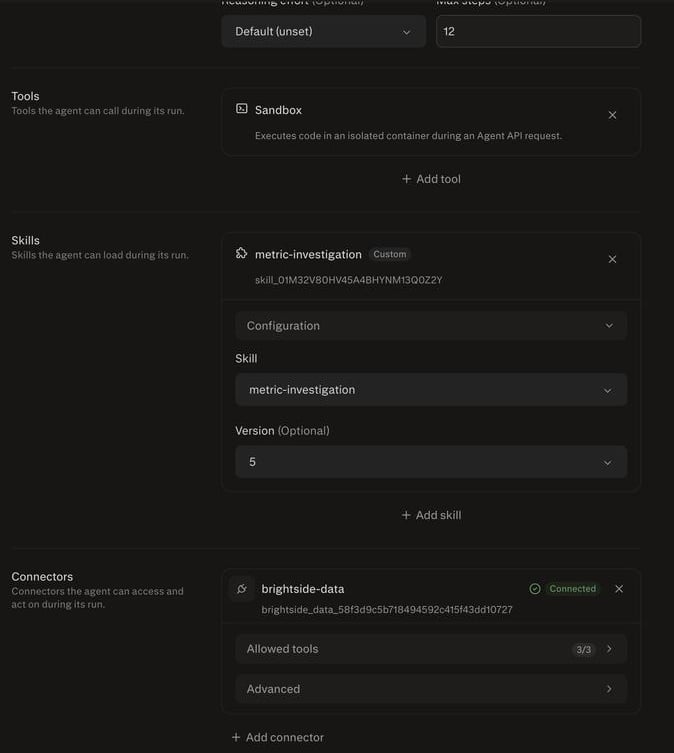
Save the profile and copy its ID. Select the skill revision you uploaded; version numbers in your Project can differ from the screenshot. Your client now needs the profile ID and a Perplexity API key from the same Project, not the server token or another copy of the agent's instructions.
Ask your first question
Section titled “Ask your first question”From the folder containing the ask.py you created above, activate the environment and enter your Project API key at the hidden prompt. Replace the profile placeholder with your saved ID.
Send the investigation to Agent API
source .venv/bin/activate
read -s PERPLEXITY_API_KEY
export PERPLEXITY_API_KEY
export BRIGHTSIDE_PROFILE_ID=profile_YOUR_ID
python ask.py --ask "Why did paid conversions drop in the week of September 7 through September 13, 2026?"
The client passes your question as input to client.responses.create(). Agent API uses the saved profile to give the agent its instructions, skill, connector, and tools. You do not write the investigation's SQL in the application.
The sample ends on September 13, 2026, so use explicit dates rather than "last week." Compare your agent's output with these known non-test counts:
| Week starting | Signups | Same-week paid conversions |
|---|---|---|
| August 17 | 567 | 143 |
| August 24 | 580 | 137 |
| August 31 | 544 | 110 |
| September 7 | 384 | 90 |
The expected finding is a measurement problem that prevents a confident conclusion about customer behavior. Recorded same-week conversions fall from 110 to 90, while mobile signup records disappear from September 9 through September 12. Non-test billing starts rise from 158 to 170 across the two weeks, so the signup and billing records do not tell the same story.
Missing signup records affect both the conversion count and its denominator. A higher observed conversion rate does not prove better purchase performance, and these tables cannot establish the true rate. Billing accounts without a signup in the same week may have signed up earlier; they are not all missing from the signup table.
Review the daily diagnostics as well as the headline: each must exclude test accounts. Device, segment, and plan breakdowns must keep the same calendar-week definition. If a required diagnostic fails, the answer should name the missing evidence instead of presenting the investigation as complete.
Agent API returns evidence you can inspect, not a guarantee of correct reasoning. ask.py saves the complete response under runs/<response-id>/response.json; check executed queries and their outputs, not only SQL quoted in the answer.
Inspect the Agent API response
python - <<'PY'
import json
from pathlib import Path

response_id = json.loads(Path("last_response.json").read_text())["id"]
receipt = json.loads((Path("runs") / response_id / "response.json").read_text())
for item in receipt["output"]:
    if item["type"] in {"mcp_call", "sandbox_results", "sandbox_write_file", "share_file"}:
        print(json.dumps(item, indent=2))
PY
Continue the conversation and get a chart
Section titled “Continue the conversation and get a chart”Next, ask the same agent to focus on enterprise customers. The client sends previous_response_id with your new question so the Agent API request continues the earlier conversation. Keep the profile unchanged during the walkthrough, and run the follow-up from the same working folder.
Request an enterprise chart in the same conversation
python ask.py --follow-up "Now show that for enterprise customers only, with a chart of weekly signups and paid conversions for the last four weeks."Your agent can query the enterprise data and prompt Sandbox to create a chart. Sandbox determines what code runs. The client downloads shared files separately through the response files endpoints into runs/<response-id>/files/.
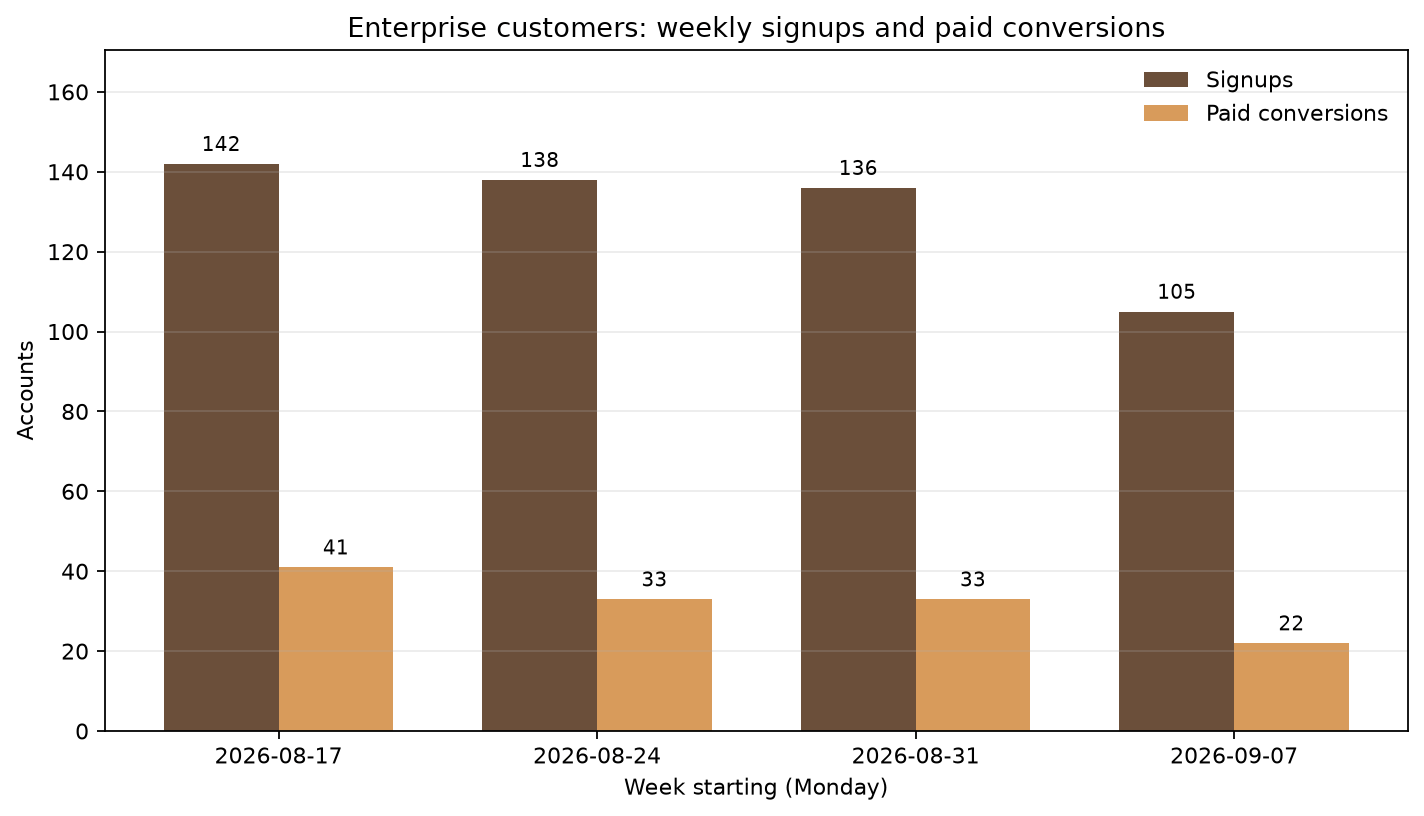
The example chart's eight labels match the synthetic, non-test enterprise counts. The final week includes the tracking gap; these are recorded counts, not reconstructed events. Compare your chart against the successful SQL results before sharing it.
Check that your response includes both a downloaded PNG and the JSON used to create it. The chart should have a zero baseline, explicit week dates, a cohort title, and all eight count labels. Include the synthetic-data and September 9 to 12 tracking-gap note with the chart, even if the generated image omits it. If a file or label is missing, request a correction in the same conversation and check the returned files again.
Your application sent another question rather than adding a SQL prompt or charting workflow. Keep each conversation in its own working folder, since the client stores one last-completed-response checkpoint per folder.
Reuse the profile from another application
Section titled “Reuse the profile from another application”Another application can use the same profile with an API key from the same Project. Pin your tested profile version to keep later configuration edits from changing what that application requests.
Request a tested profile version
python ask.py --version YOUR_TESTED_VERSION --ask "How many non-test signups from August 24 through August 30, 2026 started a paid subscription in that same Monday-to-Sunday week? Show your SQL and the count."The client sets profile.version in the Agent API request. Replace YOUR_TESTED_VERSION with the version you verified; the expected count for this sample is 137. Pinning configuration does not freeze external data or guarantee identical answers. For a pinned conversation, pass the same --version on both the initial request and each follow-up.
Optional: compare a different model
Section titled “Optional: compare a different model”The default model is sufficient for the investigation and chart. To evaluate another model, use --model to set the Agent API request's model field while retaining the profile. The client supplies the output-token limit used for this Anthropic request. This is an optional evaluation, not a required step or a promise of equivalent analytical quality.
Override the model for one request
python ask.py --ask "Why did paid conversions drop in the week of September 7 through September 13, 2026?" --model anthropic/claude-sonnet-4-6One earlier run returned 35 then 31 conversions instead of 110 then 90. Its SQL required signup and subscription to occur on the same day, not within the same week.
Recorded output excerpt
## Finding

Paid conversions dropped in the week of Sep 7 to 13 largely because **signups collapsed by ~30%** (from a recent high of ~560 to 580 to just 384), not because the conversion rate itself fell dramatically. The funnel's top of funnel dried up; conversion rate held reasonably steady. This points to a **traffic/acquisition problem**, not a checkout or billing failure.

---

## Evidence

Using the team's definition of **paid conversions** (subscriptions started in the same week the account signed up, excluding `is_test = 1` accounts) and **conversion rate** (paid conversions ÷ signups that week):

| Week (Mon to Sun) | Signups | Paid Conversions | Conv. Rate |
|---|---|---|---|
| Aug 3 to 9 | 515 | 30 | 5.8% |
| Aug 10 to 16 | 536 | 47 | 8.8% |
| Aug 17 to 23 | 567 | 50 | 8.8% |
| Aug 24 to 30 | 580 | 40 | 6.9% |
| Aug 31 to Sep 6 | 544 | 35 | 6.4% |
| **Sep 7 to 13** | **384** | **31** | **8.1%** |

Key observations:
- **Signups fell from 544 → 384**, a drop of **160 signups (−29%)** ; the sharpest single-week decline in the dataset.
- **Paid conversions fell from 35 → 31**, a drop of only **4 (−11%)**.
- **Conversion rate actually ticked up** from 6.4% to 8.1%, suggesting the billing/checkout step was not broken ; people who signed up were converting at a normal-to-healthy rate.
- The problem is entirely concentrated at the **top of the funnel**: far fewer people signed up in the first place.

This rules out a billing pipeline failure or a checkout UX regression. The most likely causes are a paid marketing campaign that ended or a budget cut, a traffic source that went dark, or a tracking gap in the signups pipeline itself (worth checking whether the checkout tracking pipeline had any downtime that week).

---

mcp_call items: 6
cost: $0.15213
response id: resp_0d70995d-fa91-4857-87da-0d8017ed72b2
Treat this as a failed analysis. Correct SQL alone is not enough either: reject unsupported claims that the true conversion rate improved, that the business is unaffected, or that every unmatched billing account has no signup record. Profiles let you reuse a configuration across requests; you still need to evaluate each model's results.
Run the sample server locally
Section titled “Run the sample server locally”Skip this section if your connector already reaches a hosted server. This supplies test data for the Agent API tutorial; it is not application-side agent orchestration.
This path adds just one file, data_server.py, to your working folder. Install its dependency in the environment you created above:
Install the local MCP dependency
source .venv/bin/activate
pip install mcp==2.2.0
Create the sample data server
Section titled “Create the sample data server”Copy the complete code below into data_server.py. This server supplies the connector's data tools; Agent API still runs the investigation.
data_server.py
import atexit
import hmac
import json
import os
import random
import re
import sqlite3
from datetime import date, timedelta

import uvicorn
from mcp.server.mcpserver import MCPServer
from mcp.server.transport_security import TransportSecuritySettings
from starlette.responses import JSONResponse

LAST_DAY = date(2026, 9, 13)
FIRST_DAY = LAST_DAY - timedelta(days=41)
GAP_DAYS = {date(2026, 9, 9) + timedelta(days=i) for i in range(4)}
PLANS = [("starter", 29), ("pro", 79), ("enterprise", 299)]
SEGMENTS = ["smb", "smb", "mid_market", "enterprise"]


def build_rows():
    rng = random.Random(7)
    accounts, signups, subscriptions = [], [], []
    account_id = 1000
    day = FIRST_DAY
    while day <= LAST_DAY:
        for _ in range(rng.randint(70, 90)):
            account_id += 1
            plan, price = rng.choice(PLANS)
            device = "mobile" if rng.random() < 0.55 else "web"
            is_test = 1 if rng.random() < 0.03 else 0
            provisioned_by = "sales" if rng.random() < 0.1 else "self_serve"
            accounts.append((account_id, plan, rng.choice(SEGMENTS), is_test, provisioned_by))
            if not (device == "mobile" and day in GAP_DAYS):
                signups.append((account_id, day.isoformat(), device))
            if rng.random() < 0.3:
                started = day + timedelta(days=rng.randint(0, 3))
                if started <= LAST_DAY:
                    subscriptions.append((account_id, started.isoformat(), price))
        day += timedelta(days=1)
    return accounts, signups, subscriptions


def create_db():
    connection = sqlite3.connect(":memory:", check_same_thread=False)
    connection.executescript(
        "CREATE TABLE accounts (id INTEGER PRIMARY KEY, plan TEXT, segment TEXT,"
        " is_test INTEGER, provisioned_by TEXT);"
        "CREATE TABLE signups (account_id INTEGER, day TEXT, device TEXT);"
        "CREATE TABLE subscriptions (account_id INTEGER, started_day TEXT, amount_usd REAL);"
    )
    accounts, signups, subscriptions = build_rows()
    connection.executemany("INSERT INTO accounts VALUES (?, ?, ?, ?, ?)", accounts)
    connection.executemany("INSERT INTO signups VALUES (?, ?, ?)", signups)
    connection.executemany("INSERT INTO subscriptions VALUES (?, ?, ?)", subscriptions)
    connection.commit()
    connection.execute("PRAGMA query_only = ON")
    return connection


CONTEXT = {
    "date_range": f"{FIRST_DAY} to {LAST_DAY}; weeks run Monday to Sunday",
    "tables": {
        "accounts": "One row per customer account. is_test = 1 marks internal test accounts.",
        "signups": "One row per account signup, written by the checkout tracking pipeline. device is 'web' or 'mobile'.",
        "subscriptions": "One row per paid subscription, written by billing when the first payment clears.",
    },
    "definitions": [
        {
            "name": "paid_conversion_rate",
            "definition": "Subscriptions started in a week from accounts that signed up in that same week, divided by signups that week. Exclude accounts where is_test = 1.",
        },
        {
            "name": "enterprise_conversion_rate",
            "definition": "paid_conversion_rate restricted to accounts where segment = 'enterprise'.",
        },
    ],
    "documents": [
        {
            "title": "Mobile checkout tracking change",
            "text": f"Mobile checkout tracking changed on {min(GAP_DAYS)}. Signups from the mobile app may be missing until the fix ships.",
        }
    ],
    "queries": [
        {
            "name": "weekly_signups_by_device",
            "reviewed": True,
            "sql": "WITH weeks(start) AS (VALUES ('2026-08-17'), ('2026-08-24'), ('2026-08-31'), ('2026-09-07')) SELECT w.start, s.device, COUNT(*) AS signups FROM weeks w JOIN signups s ON s.day BETWEEN w.start AND date(w.start, '+6 days') JOIN accounts a ON a.id = s.account_id WHERE a.is_test = 0 GROUP BY w.start, s.device ORDER BY w.start, s.device",
        }
    ],
}

db = create_db()
atexit.register(db.close)
mcp = MCPServer("brightside-data")
WORDS = lambda text: [word.rstrip("s") for word in re.findall(r"[a-z0-9]+", text.lower())]


@mcp.tool()
def describe_tables() -> dict:
    """List every table with its columns and a note on what writes it. Call this first."""
    tables = {}
    for (name,) in db.execute("SELECT name FROM sqlite_master WHERE type = 'table' ORDER BY name"):
        columns = [row[1] for row in db.execute(f"PRAGMA table_info({name})")]
        tables[name] = {"columns": columns, "note": CONTEXT["tables"].get(name, "")}
    return {"date_range": CONTEXT["date_range"], "tables": tables}


@mcp.tool()
def search_context(query: str) -> dict:
    """Find metric definitions, team notes, and reviewed SQL that mention the query text. Search here before defining a metric yourself."""
    words = set(WORDS(query))
    results = []
    for kind in ("definitions", "documents", "queries"):
        for item in CONTEXT[kind]:
            if words and words <= set(WORDS(json.dumps(item))):
                results.append({"kind": kind, **item})
    return {"query": query, "results": results}


@mcp.tool()
def run_sql(sql: str) -> dict:
    """Run one read-only SQLite SELECT or WITH statement and return up to 100 rows."""
    statement = sql.strip().rstrip(";").strip()
    if ";" in statement or not re.match(r"(?is)(select|with)\b", statement):
        return {"error": "Only one SELECT or WITH statement is allowed."}
    try:
        cursor = db.execute(statement)
        rows = cursor.fetchmany(101)
    except sqlite3.Error as error:
        return {"error": str(error)}
    columns = [column[0] for column in cursor.description or []]
    return {"columns": columns, "rows": [list(row) for row in rows[:100]], "truncated": len(rows) > 100}


KEY = os.environ.get("DATA_SERVER_KEY", "")


class RequireKey:
    def __init__(self, app):
        self.app = app

    async def __call__(self, scope, receive, send):
        if scope["type"] == "http":
            headers = {name.decode().lower(): value.decode() for name, value in scope["headers"]}
            sent = headers.get("authorization", "")
            if not hmac.compare_digest(sent, f"Bearer {KEY}"):
                print(f"rejected {scope['method']} {scope['path']}: no valid key")
                response = JSONResponse({"error": "missing or wrong API key"}, status_code=401)
                await response(scope, receive, send)
                return
        await self.app(scope, receive, send)


if __name__ == "__main__":
    if not KEY:
        raise SystemExit("Set DATA_SERVER_KEY before starting the server.")
    print("MCP endpoint: http://127.0.0.1:8000/mcp")
    print("Next, in another terminal: cloudflared tunnel --url http://localhost:8000")
    security = TransportSecuritySettings(enable_dns_rebinding_protection=False)
    app = RequireKey(mcp.streamable_http_app(transport_security=security, json_response=True))
uvicorn.run(app, host="127.0.0.1", port=8000)- Sample data:
build_rows()creates the same data each time.create_db()loads it into memory and enables SQLite's query-only mode. No database or context file needs to be created. - Company context:
CONTEXTholds table descriptions, metric definitions, and the tracking-change note. - Connector tools:
describe_tables,search_context, andrun_sqlexpose the data. Context search matches every search word; SQL results are capped at 100 rows. - Server entry point:
RequireKeychecks the bearer token. The server requires a token and uses JSON responses over Streamable HTTP.
The sample contains 3,382 accounts, 3,222 signups, and 971 subscriptions. Four days of mobile signup events are deliberately missing while billing records remain.
Make the server reachable
Section titled “Make the server reachable”The connector needs a remotely reachable MCP endpoint. This local path uses Cloudflare's cloudflared tunnel; Agent API does not require Cloudflare. Install it with brew install cloudflared on macOS, or use Cloudflare's downloads.
Use only synthetic data. In terminal 1, activate the environment, enter a random server token at the hidden prompt, and start the server.
Terminal 1: start the sample server
source .venv/bin/activate
read -s DATA_SERVER_KEY
export DATA_SERVER_KEY
python data_server.py
Keep it running. In terminal 2, start the tunnel and leave it open too.
Terminal 2: expose the local endpoint
cloudflared tunnel --url http://localhost:8000In terminal 3, enter the HTTPS URL plus /mcp, then the same server token. Check authentication before registering the connector.
Terminal 3: check the MCP endpoint
read MCP_URL
read -s DATA_SERVER_KEY
export MCP_URL DATA_SERVER_KEY
BODY='{"jsonrpc":"2.0","id":1,"method":"initialize","params":{"protocolVersion":"2025-06-18","capabilities":{},"clientInfo":{"name":"curl","version":"1"}}}'
curl -i "$MCP_URL" -H 'content-type: application/json' \
  -H 'accept: application/json, text/event-stream' -d "$BODY"
curl -i "$MCP_URL" -H 'content-type: application/json' \
  -H 'accept: application/json, text/event-stream' \
  -H "Authorization: Bearer $DATA_SERVER_KEY" -d "$BODY"
Expect 401 without the token and 200 with it. Return to Connect the agent to your data to register the endpoint and finish configuring the profile.
When finished, stop only your local server and tunnel and unset exported token variables. Leave shared hosted services running. Keep credentials and raw responses out of source control.
Troubleshooting
Section titled “Troubleshooting”- Connector unavailable: Check the server, token, URL, and Project. Restarting a quick tunnel changes its URL; replace the connector if you cannot edit that endpoint.
- No executed SQL: Inspect connector errors and Sandbox results, including nested exit codes. Proposed SQL and a
completedstatus do not prove a successful investigation or helper execution. - Wrong counts: Check the non-test filter and same-week boundaries. The server caps returned rows, not query computation.
- Missing chart: Inspect
share_fileitems and the file download step. Asandbox:path is not a local download. If Sandbox cannot locate the bundled helper, the skill permits an equivalent chart; verify the returned PNG and JSON rather than assuming that helper ran. - Incomplete response: Inspect the saved status, error, and incomplete details before raising the step budget.